@ozzcar tú que eres entendido en materias de salud, me ayudas a interpretar está tabla de mortalidad de los últimos 5 años. Creo que Chile es el único país latinoamericano estudiado ya que es de los pocos que cuenta con cifras fiables.

www.cebm.net
| Country | Expected Age-standardised Mortality 2020 (per 100,000) | Age-standardised total excess mortality per 100,000 | Excess age-standardised mortality per 100,000 | Percentage increase in Mortality per Age-Adjusted 100,000 |
| Austria | 938 | 1009 | 71 | 7.6% |
| Belgium | 956 | 1072 | 116 | 12.2% |
| Bulgaria | 1597 | 1788 | 191 | 12.0% |
| Canada | 709 | 751 | 42 | 6.0% |
| Chile* | 1041 | 1184 | 143 | 13.8% |
| Czechia | 1147 | 1258 | 111 | 9.7% |
| Denmark | 1016 | 972 | -44 | -4.3% |
| England & Wales | 960 | 1060 | 100 | 10.5% |
| Estonia | 1178 | 1178 | 0 | 0% |
| Finland | 948 | 919 | -29 | -3.1% |
| France | 839 | 895 | 56 | 6.7% |
| Germany* | 1016 | 1049 | 33 | 3.3% |
| Greece* | 912 | 957 | 45 | 4.9% |
| Hungary | 1420 | 1473 | 53 | 3.7% |
| Iceland | 755 | 724 | -31 | -4.1% |
| Israel | 864 | 920 | 56 | 6.5% |
| Italy | 728 | 792 | 63 | 8.7 |
| Latvia | 1446 | 1414 | -32 | -2.2% |
| Lithuania | 1393 | 1468 | 75 | 5.4% |
| Luxembourg | 842 | 852 | 9.5 | 1.1% |
| Netherlands | 971 | 1040 | 70 | 7.2% |
| Norway | 893 | 861 | -32 | -3.6% |
| Poland | 1216 | 1391 | 175 | 14.4% |
| Portugal | 977 | 1043 | 66 | 6.8% |
| Scotland | 1134 | 1219 | 85 | 7.5% |
| Slovakia | 1219 | 1236 | 17 | 1.4% |
| Slovenia | 996 | 1116 | 120 | 12.0% |
| South Korea | 779 | 757 | -22 | -2.9% |
| Spain | 838 | 946 | 108 | 12.9% |
| Sweden | 883 | 896 | 13 | 1.5% |
| Switzerland | 783 | 817 | 34 | 4.3% |
| USA | 1020 | 1152 | 132 | 12.9% |
Canada only has data up to week 42, and Iceland and Italy up to week 44. Slovakia only has data up to week 48, and Greece & South Korea up to week 49. Switzerland & Czechia are based on data up to week 50, and Hungary, Slovenia, and the USA based on data up to week 51.
Observations.
Relative excess mortality in the countries we have examined ranges from -4.3% to 14.4% and is strongly positively correlated with the recorded number of COVID-19 deaths (r = 0.8). Denmark, Finland, Iceland, Latvia and Norway experienced fewer deaths in 2020 according to our analysis. As we would expect these countries have recorded a lower number of COVID-19 deaths than other countries. For example, Iceland, Norway and Finland have all recorded fewer than 12 per 100k COVID-19 deaths. Denmark and Latvia are perhaps exceptions to this having recorded 32 COVID-19 deaths per 100k and Latvia 54 per 100k.
A number of eastern European countries saw little or no excess deaths in the first half of the year but have experienced significant excess mortality in the second half of 2020. Bulgaria, Czechia, Croatia, Hungary, Lithuania, Luxembourg, Poland, Slovakia, and Slovenia with Poland and Bulgaria exhibiting levels of excess mortality of the same order of magnitude as the countries in the centre of the first wave (e.g. Spain, France, England and Wales, Italy).
The USA which has often been cited as the worse affected country (often using the total number of COVID-19 deaths) has relative excess of 12.9% which although one of the highest, is below some with even higher relative excess mortality such as Poland and Chile.











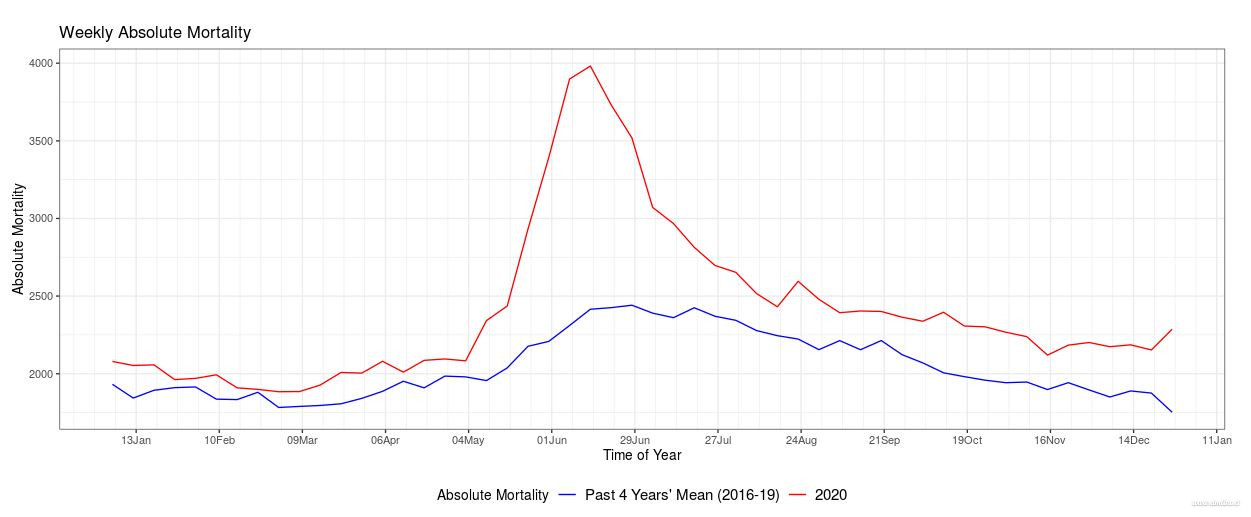


 3251 muertos en bolsonalandia